PS: 34% (-1)
PSD: 26.4% (-0.5)
CDU: 11% (+1)
CDS: 10% (-0.1)
BE: 9% (-0.5)
The PM has the worst approval rating of any party leader. 60% of voters want the President to send the budget to the Constitutional Court for preventive constitutional review before promulgating, while 23% want a downright veto. Massive headache over at Belém Palace, I'm guessing. Here.
sexta-feira, dezembro 14, 2012
segunda-feira, dezembro 10, 2012
Polls since the 2011 election

terça-feira, novembro 27, 2012
Pitagórica, 9-16 Nov, N=505, Tel.
PS: 36.2 % (+2.1)
PSD: 26.4% (-3.1)
CDU: 9.8% (+0.7)
CDS-PP: 9.8% (+1.5)
BE: 7.5% (+0.3)
Tem sido dado muito destaque a um dos resultados da sondagem, a ideia de que "três em dez inquiridos defende uma intervenção dos militares". Mas vejamos bem a pergunta e as respostas:
"Vasco Lourenço tem vindo a sugerir por diversas vezes que os militares podem estar na eminência de um golpe militar que restaure o 'espírito de Abril'. Os militares devem tomar alguma iniciativa contra este governo?"
Sim: 29.3%
Não: 63%
Ns/Nr: 7.7%
Primeiro, é duvidoso que a introdução sirva apenas para relembrar algo que os inquiridos já saibam. Pelo contrário: não sei até que ponto a generalidade dos eleitores segue as declarações de Vasco Lourenço sobre estes temas, mas é provável que, para muitos, a introdução que foi feita à pergunta coloque os inquiridos perante um elemento completamente novo. Segundo, uma pesquisa rápida revela frases de Vasco Lourenço como, por exemplo, "a hipótese de um golpe militar não tem qualquer sentido". Assim, o estímulo é novo para uns e, para outros, contraditório. Finalmente, "tomar alguma iniciativa contra este governo" pode significar muitas coisas diferentes. Logo, eu resistiria a tirar conclusões precipitadas deste resultado.
sábado, novembro 17, 2012
Eurosondagem, 7-13 Nov, N=1033, Tel.
PS: 35% (+0.2)
PSD: 26.9% (-3.1)
CDS-PP: 10.1% (+0.1)
CDU: 10% (+0.5)
BE: 9.5% (+1.8)
Pedro Passos Coelho, the PM, remains the most unpopular party leader. Here.
PSD: 26.9% (-3.1)
CDS-PP: 10.1% (+0.1)
CDU: 10% (+0.5)
BE: 9.5% (+1.8)
Pedro Passos Coelho, the PM, remains the most unpopular party leader. Here.
terça-feira, novembro 13, 2012
Aximage, 2-6 Nov., N=602, Tel.
PS: 32.1% (-1.6)
PSD: 26.3% (+1.4)
CDU: 9.6% (+0.1)
CDS: 7.9% (=)
BE: 7.5% (+0.5)
There are 5.2% undecided. The PM is the party leader with lower approval. The Minister of Economy, Álvaro Santos Pereira, is the cabinet member - except the PM - with lower approval. Here.
PSD: 26.3% (+1.4)
CDU: 9.6% (+0.1)
CDS: 7.9% (=)
BE: 7.5% (+0.5)
There are 5.2% undecided. The PM is the party leader with lower approval. The Minister of Economy, Álvaro Santos Pereira, is the cabinet member - except the PM - with lower approval. Here.
segunda-feira, novembro 05, 2012
Eleições americanas: o estado da corrida
Não há outras eleições no mundo que recebam tanta atenção e sobre as quais se saiba tanto como as presidenciais americanas. As razões são óbvias: elas ocorrem na maior potência económica e militar do planeta e numa das suas democracias mais antigas, e são estudadas pela maior comunidade de especialistas sobre o tema. Isto não significa que haja certezas inabaláveis sobre o que move o eleitorado americano, e muito menos sobre o desfecho de uma eleição em particular. Mas significa que é possível falar sobre cada eleição na posse de informação incomparavelmente mais rica do que sucede com a esmagadora maioria das eleições. O que se segue é uma de muitas sínteses possíveis de toda essa informação.
O longo prazo
A primeira coisa que se julga saber sobre as presidenciais americanas é que os seus resultados têm características cíclicas. Pelo menos desde o final do século XIX, existe um padrão através do qual, a cada período de bons resultados para os candidatos de um dos partidos, se sucede, de forma regular, um período de bons resultados para os candidatos do outro partido. Várias hipóteses são avançadas para explicar este fenómeno. Na medida em que estar no poder conceda vantagens eleitorais para um candidato, o facto de um presidente em exercício se poder candidatar a um segundo mandato mas não a um terceiro introduz desde logo um elemento de ciclicidade: é sempre mais provável que um presidente consiga a reeleição, mas cumpridos esses dois mandatos, a competição entre os partidos reequilibra-se. Sabe-se também que o eleitorado americano reage às políticas públicas como uma espécie de termóstato: em face de políticas mais conservadoras por parte de presidentes Republicanos, os eleitores moderados respondem pedindo a correção dos excessos de conservadorismo; em face de políticas mais “liberais” (no sentido americano), a correção funciona na direção oposta. O resultado disto é que os americanos não consentem que um mesmo partido controle a Casa Branca por demasiado tempo.
Há quatro anos, vários artigos na imprensa usavam estas ideias para sugerir a possibilidade de que Obama se preparasse para inaugurar um novo ciclo político, que o poderia colocar no poder até 2016. Contudo, um estudo publicado há poucos meses no American Journal of Political Science mostrava que esses ciclos políticos, prevalecentes desde 1890, se tornaram mais curtos desde os anos 60 do século passado, não havendo sequer apoio empírico para sua a existência a partir dos anos 80. Não se sabe bem o que terá perturbado a ciclicidade eleitoral americana. O aparecimento ocasional de “terceiros candidatos” relevantes, tal como em 1992 e, em menor grau, 2000? A crescente polarização ideológica de políticos e eleitores, aumentado a radicalização das políticas adoptadas e, logo, acelerando as reações negativas dos eleitores? A crescente instabilidade das identificações partidárias? Não se sabe, mas o certo é que um dos padrões de longo prazo que poderia dar alguma segurança a Obama nesta eleição concreta parece ter desaparecido.
O médio prazo
Uma das conclusões mais seguras sobre o que determina o desempenho eleitoral de um partido no governo é que ele é fortemente afectado pela situação da economia. É isso que faz com que, a uma razoável distância de uma eleição (de seis meses a um ano), enquanto as sondagens ainda vão mostrando grande volatilidade, já seja possível prever, dentro de um intervalo de resultados razoavelmente apertado, qual a percentagem de votos que o partido de governo irá obter na próxima eleição. Todos os anos de eleições, por volta de Julho, a comunidade de forecasters eleitorais nos Estados Unidos começa a divulgar as suas previsões, feitas na base de modelos econométricos. As variáveis económicas destes modelos incluem, por exemplo, o crescimento da economia e do rendimento disponível, a taxa de desemprego, a evolução da despesa pública ou as percepções que os eleitores fazem do estado da economia, medidas através de sondagens.
Da análise destes modelos e dos seus resultados para a eleição de 2012 decorrem pelo duas conclusões. A primeira é que a evolução da economia americana no último ano não foi nem suficientemente má para condenar Obama à derrota nem suficientemente boa para o impulsionar decisivamente para a vitória. Os diferentes modelos, cujas previsões variavam ligeiramente dependendo dos aspectos concretos da economia que valorizavam e dos outros factores que tomavam em conta, apontavam, em média, para uma percentagem da votação nacional para Obama (em relação ao total de votos para os dois maiores partidos) de 50,4%. Em suma, apontavam para uma eleição que, pelo menos do ponto de vista do voto popular, deveria ser uma das mais renhidas de sempre.
A segunda conclusão tem interesse para além do contexto específico desta eleição: só relativamente tarde na campanha as sondagens começam a convergir para resultados que os modelos de previsão já conseguem revelar com razoável antecedência. Isto sugere que a sucessão de eventos que caracteriza uma campanha, as “gafes”, as entrevistas nos “talk shows”, os debates e os esforços gerais de mobilização e persuasão por parte das campanhas acabam por fazer menos diferença no resultado final do que possa parecer. Em parte, porque esses esforços de persuasão e mobilização das duas candidaturas são geralmente tão eficazes e equilibrados entre si que se cancelam mutuamente. Em parte também porque os eventos de campanha são interpretados pelos eleitores à luz das suas predisposições políticas latentes, formadas com alguma antecedência, que os modelos de previsão parcialmente captam, e que a campanha acaba por ativar mais do que modificar. E finalmente, porque tendo em conta o efeito dessas predisposições no voto, o espaço que sobra para que os eventos de campanha possam produzir grandes mudanças acaba por ser, afinal, relativamente reduzido.
O curto prazo
Dito isto, houve dois eventos que de facto fizeram diferença nas intenções de voto nos últimos meses. Sabemos isso com alguma segurança devido ao grande número de sondagens que se realizam nos Estados Unidos e à multiplicação de sites que as analisam de diferentes maneiras. O Real Clear Politics limita-se a calcular médias, nacionais e por estado. Outros, como o Five Thirty Eight de Nate Silver, o Pollster de Mark Blumenthal e Simon Jackman, o Votamatic de Drew Linzer ou o Princeton Election Consortium de Sam Wang, também usam as sondagens como matéria prima, mas agregam-nas de diferentes maneiras, ponderando-as não apenas na base da dimensão das amostras mas também, nalguns casos, do desempenho passado das empresas que as realizam ou de tendências gerais que se sabe afectarem determinados conjuntos de estados. O que todos estes sites mostram é que, à data em que escrevo este texto, Obama e Romney estão praticamente empatados nas intenções de voto a nível nacional, porventura até com ligeira vantagem para Romney. Mas nem sempre foi assim. No início de Setembro, a convenção Democrata atirou Obama para uma vantagem que chegou a ser, segundo estas análises, de 5 pontos percentuais. No início de Outubro, o primeiro debate entre os dois candidatos, onde Romney derrotou Obama, neutralizou essa vantagem. Os eventos nas campanhas, afinal, podem fazer diferença. Raramente e pouco, é certo, mas o suficiente para poderem ser decisivos.
Contudo, a outra coisa que todos estes “agregadores de sondagens” mostram é que este “empate” entre Obama e Romney é enganador. As presidenciais americanas são eleições indiretas, para um colégio eleitoral com 538 membros, eleitos estado a estado por um sistema maioritário de lista. Por outras palavras, o candidato que conquistar mais votos num estado elege a totalidade dos “grandes eleitores” desse estado. São eles, em conjunto com os dos outros estados, quem elege o Presidente. E desse ponto de vista, Obama parece ter alguma vantagem. Desde Junho deste ano que os candidatos têm limitado as suas ações de campanha a cerca de dez estados. Isto sucede porque 41 deles – incluindo o Distrito de Columbia – se encontram, para todos os efeitos, “decididos”. Mesmo com as estimativas mais cautelosas, a vantagem de Romney em 23 estados - especialmente localizados no Sul e no Noroeste do país – é de tal modo grande que se pode já dizer que, dos 270 lugares no colégio eleitoral de que precisa para a vitória, 191 deverão estar garantidos. O problema para Romney é que o seu adversário se encontra em situação semelhante em 18 estados que elegem nada menos que 217 “grandes eleitores.” Faltam-lhe, por assim dizer, apenas 53, contra os 79 de que Romney precisa. Dos estados ainda em disputa, Pennsylvania e Wisconsin, onde há mais de vinte anos não ganham republicanos, deverão estar seguros para Obama. Basta-lhe adicionar vitórias no Ohio e no Nevada (ou no Iowa), por exemplo, onde atualmente lidera as sondagens estaduais, para a presidência ser sua. Quanto a Romney, o único estado ainda em disputa que se pode colocar com alguma segurança na sua contagem é a Carolina do Norte. O seu caminho até à vitória é mais íngreme.
Que surpresas são ainda possíveis? Uma delas seria uma deslocação dos eleitores na recta final a favor de Romney que fosse de tal modo expressiva que colocasse Obama em desvantagem nos estados ainda em disputa e onde por enquanto ainda tem vantagem (Ohio, Nevada, Iowa, Virgínia, New Hampshire e Colorado). Chamamos-lhe “surpresa” porque, como já vimos, os eventos capazes de produzir semelhantes deslocações são raros. A segunda surpresa seria se as sondagens na base das quais repousam todos estes cenários estivessem, afinal, erradas. “Erradas”, neste contexto, teria de significar que estariam, na sua generalidade, sejam as nacionais sejam as estaduais, afectadas por um qualquer enviesamento que esteja a subestimar sistematicamente a votação em Romney. Muitos argumentos têm sido usados para apoiar a plausibilidade dessa ideia, tais como as baixas taxas de resposta às sondagens, o grande número de eleitores que tem apenas telefone móvel ou a dificuldade em estimar quem são de facto os “votantes prováveis”. Mas isso seria também uma grande surpresa. Nada na investigação existente sugere que esses potenciais problemas tendam a levar a uma subestimação dos votos nos candidatos republicanos. Estes problemas, certamente já presentes em 2000, 2004 ou 2008, não produziram esses alegados efeitos. Em suma, tudo ponderado, Obama é, sem dúvida, favorito. Mas pensem nisto de outra forma: peguem num dado; escolham um resultado possível, por exemplo, o 5. Lancem o dado repetidamente. De cada vez que vos sair um 5, foi Romney que ganhou a eleição. É isto, mais coisa menos coisa, que nos dizem as sondagens. Pouco provável, sim. Impossível, não.
Publicado originalmente no Público.
segunda-feira, outubro 22, 2012
Pitagórica, 8-12 Oct., N=503, Tel.
PS: 34,1%
PSD: 29,5%
CDU: 9,1%
CDS-PP: 8,3%
BE: 7,2%
Here. Other findings: massive government disapproval and preference over cutting expenditure over increasing taxes, although this last question appears to have been formulated in a way - "Should the government cut expenditures instead of increasing taxes?" - that is probably not the best. Also interesting is where people thought where cuts should be made: 61% public companies, 38% local government, 0,7% education, 0,3% health. Besides the question of what the response categories actually were, one wonders how many respondents understood the real implications of their answers...
sexta-feira, outubro 19, 2012
Polls in Portugal, update
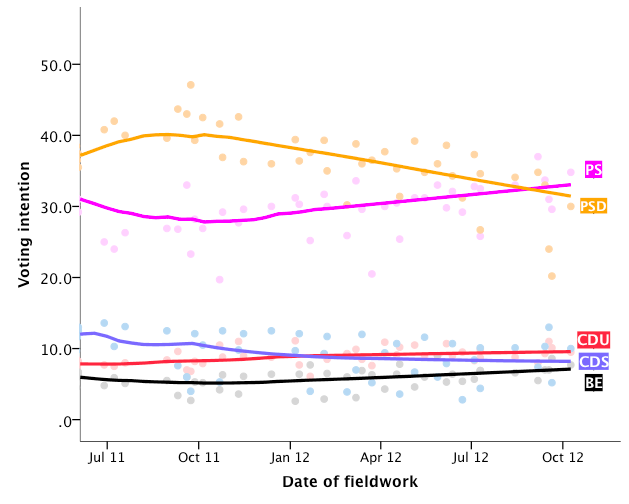
The LOWESS line uses a 25% bandwidth. The rest is self-explanatory, I trust.
segunda-feira, outubro 15, 2012
Rescaldo sondagens Açores
Pouca coisa para trabalharmos. O site da ERC regista uma sondagem de intenção de voto, realizada pela Eurosondagem, com trabalho de campo terminado a 2 de Outubro. Entre parêntesis, diferença em relação aos que vieram a ser os resultados finais:
PS: 41,9% (-7,1)
PSD: 35% (+2)
CDS-PP: 9.7% (+4)
CDU: 3,7% (+1,8)
BE: 3,3%(+1)
O erro absoluto médio é 3,2, bastante acima do que sucede normalmente em sondagens nacionais. A sondagem à boca das urnas da Católica teve resultados, como teria de ser devido à sua natureza, bastante melhores:
PS: 50% (+1)
PSD: 31% (-2)
CDS-PP: 7.5% (+1.8)
CDU: 3% (+1.1)
BE: 3%(+0.7)
Desvio absoluto médio de 1.3, igual ao que se passou em 2008. E uma curiosidade: esta é a segunda eleição seguida, depois das legislativas, em que o CDS-PP é sobrestimado pelas sondagens. Algo se deverá estar a passar, ou no eleitorado do CDS ou nas sondagens.
sábado, outubro 13, 2012
terça-feira, outubro 02, 2012
Marktest, 17-20 Sept, N=805, Tel.
PS: 29.6% (+3.8)
PSD: 20.2% (-6.5)
CDU: 10.1% (+0.2)
BE: 8.6% (+1.7)
CDS-PP: 5.2% (+0.8)
Values in parentheses from previous July 2012 poll. Here.
PSD: 20.2% (-6.5)
CDU: 10.1% (+0.2)
BE: 8.6% (+1.7)
CDS-PP: 5.2% (+0.8)
Values in parentheses from previous July 2012 poll. Here.


segunda-feira, outubro 01, 2012
Before the debates: polls and forecasts
Two days before the first debate, where do we stand in terms of election forecasts for the US presidential election?
1. Polls: polls are not forecasts, but they are of course informative. One obvious argument is that, the closest we get to the election, the less likely it is that any factor will emerge that may change the balance of forces. But the other - actually more plausible - argument is that, the more time elapses and the campaign progresses, the more likely it is that voters' intentions reflect the "fundamentals" of the election and the latent preferences of voters. At the moment, all poll aggregators place Obama ahead by about 4 points.
2. Models: econometric models use data from past elections, at the national or state level, and a number of contextual variables (mostly from the economy - such as change in national or per capita income, unemployment, and others - and sometimes from approval polls) to predict outcomes. The latest issue of PS collects almost all of them. The average is 50.4 for Obama, an extremely narrow advantage. An article using ensemble Bayesian model averaging of those models estimates that "between 46.4% and 52.5% of the US voters will support the incumbent in 2012, and there is a 0.60 probability that the vote for Obama will be greater than 50%." Very close indeed.
3. Prediction markets: these are markets where investors buy and sell shares of political outcomes. Their performance has been extremely good, although there is a debate on whether they are "superior" to polls when the latter are properly treated. In any case, this is what the markets have been telling us until now:
Iowa Vote Share:

Iowa probability of winning:

Intrade Obama's probability of winning:

1. Polls: polls are not forecasts, but they are of course informative. One obvious argument is that, the closest we get to the election, the less likely it is that any factor will emerge that may change the balance of forces. But the other - actually more plausible - argument is that, the more time elapses and the campaign progresses, the more likely it is that voters' intentions reflect the "fundamentals" of the election and the latent preferences of voters. At the moment, all poll aggregators place Obama ahead by about 4 points.
2. Models: econometric models use data from past elections, at the national or state level, and a number of contextual variables (mostly from the economy - such as change in national or per capita income, unemployment, and others - and sometimes from approval polls) to predict outcomes. The latest issue of PS collects almost all of them. The average is 50.4 for Obama, an extremely narrow advantage. An article using ensemble Bayesian model averaging of those models estimates that "between 46.4% and 52.5% of the US voters will support the incumbent in 2012, and there is a 0.60 probability that the vote for Obama will be greater than 50%." Very close indeed.
3. Prediction markets: these are markets where investors buy and sell shares of political outcomes. Their performance has been extremely good, although there is a debate on whether they are "superior" to polls when the latter are properly treated. In any case, this is what the markets have been telling us until now:
Iowa Vote Share:
Iowa probability of winning:
Intrade Obama's probability of winning:
quinta-feira, setembro 27, 2012
quarta-feira, setembro 26, 2012
O que tenho lido sobre as eleições americanas: uma selecção.
1. O Pollster.com, para os últimos números das sondagens nacionais e estaduais e o que implicam para o colégio eleitoral, e os comentários de Mark Blumenthal (aqui sobre o "post-convention" bounce de Obama).
2. Também sobre as sondagens (e sobre previsões que se podem fazer na sua base), Nate Silver no FiveThirtyEight.
3. Votamatic, idem.
4. John Sides, em dois blogues: YouGov e Monkey Cage. Aqui sobre como a discussão sobre os rendimentos de Romney afectaram a sua campanha, e aqui sobre as "gaffes" e o seu (duvidoso) efeito nas sondagens.
5. Brendan Nyhan, aqui sobre a estranha persistência do mito de que Obama seria muçulmano.
6. Andrew Gelman (também no Monkey Cage), sobre quase tudo o que me interessa, incluindo e para além de eleições. Aqui resumindo por que razão Romney é um mau candidato (e dificilmente outro seria bom tendo em conta aquilo em que se tornou o Partido Republicano).
7. Pollyvote, tudo sobre diferentes formas de prever resultados eleitorais.
8. Jay Cost, ajudando a que os Republicanos não percam completamente a esperança.
9. Lynn Vavreck, que contribui para vários dos blogues acima, aqui sobre os eleitores indecisos.
Tudo disto é um bocado técnico, pouco especulativo e muito colado aos dados empíricos. Mas sucede que isso é precisamente o tipo de coisa que me interessa. Para "grandes reflexões", nem sempre impecáveis do ponto de vista empírico mas sempre impecavelmente bem escritas e inteligentes, leio o David Brooks, aqui sobre as mutações do conservadorismo americano.
quinta-feira, setembro 20, 2012
More poll results and caveats
Starting with the caveats, note that in a "poll-poor" environment such as Portugal, it's understandable that a single poll gets a lot of attention. But let's not forget that a poll is just a poll. And although this last one somehow "feels right" (unlike this one), that does not make it "right" or "wrong," whatever that means when we talk about measuring public opinion. We need more data.
Furthermore, recall that the last Catholic University poll was conducted in late May/early June. This means that the massive PSD drop cannot be assigned exclusively to the measures related to social security contributions: the "Relvas affair(s)" and the privatization of public television were two very contentious issues that preceded the last austerity measures. Finally, note that the poll was conducted not only at the height (so far) of mobilization against the government but also following a week during which PSD figures, employers, unions, and even the minor coalition partners voiced their disagreement with the government's measures. So, although it is always possible that things can get worse for the PSD, it's probably safe to say that they had never as bad as in that period when the fieldwork took place.
Having said that, a few more interesting results:
* In the previous poll by the same institute, the PM was positively rated (getting 10 or more in a 0 to 20 scale) by 48% of respondents. This figure now dropped to 34%, making him the party leader with the worst approval rating.
* 78% of respondents disagree with the notion that the reduction of companies' social security contributions will help fighting unemployment, while 81% disagree with the notion this will have an impact on consumer prices. This is, in a way, a measure of how unsuccessful the communication of this measure was, as well as of the large consensus against it on the part of the kind of sources (media, expert, partisan) people likely used to form any sort of opinion about it.
* In contrast, there is an absolutely massive support for measures that were barely discussed, such as increasing taxes over luxury items or over high value real estate: support is always above 80%.
* 48% of respondents think now likely that Portugal will face a situation similar to Greece in the short-run, against 34% just three months ago.
*60% of respondents believe that no opposition party would do better than the current government if it was in power. Considering that 77% make a negative evaluation of the work of the current government, this helps explaining why, while the PSD drops in this poll, the PS fails to capitalize.
quarta-feira, setembro 19, 2012
Católica, 15-17 Set, N=1,132, Face to face
PS: 31% (-2)
PSD: 24% (-12)
CDU: 13% (+4)
BE: 11% (+2)
CDS-PP: 7% (+1)
Others: 3%
Source. The comparison is with the last Católica poll, from May 2012.
PSD: 24% (-12)
CDU: 13% (+4)
BE: 11% (+2)
CDS-PP: 7% (+1)
Others: 3%
Source. The comparison is with the last Católica poll, from May 2012.
sexta-feira, setembro 14, 2012
Eurosondagem, 10-13 Sept., n=1037, Tel.
PS: 33.7% (+0.7)
PSD: 33.0% (-1.1)
CDS-PP: 10.3% (+0.2)
CDU: 9.3% (+0.5)
BE: 7.0% (+0.4)
PSD: 33.0% (-1.1)
CDS-PP: 10.3% (+0.2)
CDU: 9.3% (+0.5)
BE: 7.0% (+0.4)
quinta-feira, setembro 13, 2012
Aximage, 3-6 Sept, n=600, Tel.
First public poll since August 17th, and first poll by this company since early July. Fieldwork predates the announcements by the Prime Minister and the Minister of Finance of new austerity measures, so you can probably see this as just giving a first inkling of the likely massacre to come.
PS: 35.4% (+4.6)
PSD: 33.3% (-1.7)
CDS-PP: 7.1% (-0.8)
I'll fill you in on the other parties when I get them.
PS: 35.4% (+4.6)
PSD: 33.3% (-1.7)
CDS-PP: 7.1% (-0.8)
I'll fill you in on the other parties when I get them.
Transatlantic Trends: alguns resultados
Os resultados do inquérito Transatlantic Trends, apoiado em Portugal pela FLAD, são divulgados em inglês e suficientemente conhecidos lá fora. Logo, passo para português neste post. Os inquéritos cobrem muitos temas, especialmente de política internacional, mas têm dado muita atenção ao tema da crise económica nos últimos anos. O trabalho de campo ocorreu em Junho passado. Destaco alguns resultados:

Em geral, com poucas excepções, há mais pessoas a avaliar positivamente a actuação da UE do que dos seus próprios governos nacionais. É natural: os governos são partidários, dividem as pessoas; a UE não é vista da mesma forma. Dito isto, é curioso que uma crise cuja responsabilidade tem sido atribuída à incapacidade de decisão na Europa permita, mesmo assim, que na maior parte dos casos a actuação da UE seja vista como positiva. Quem paga as favas são os governos: afinal, são eles que podemos castigar ou recompensar, ao contrário de uma distante e politicamente irresponsável UE. Notar também as excepções: Alemanha, Turquia e Suécia.
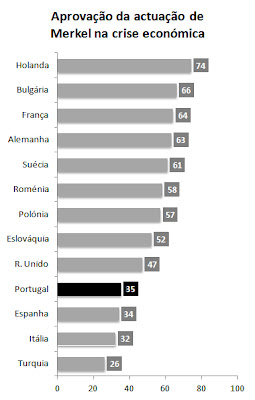
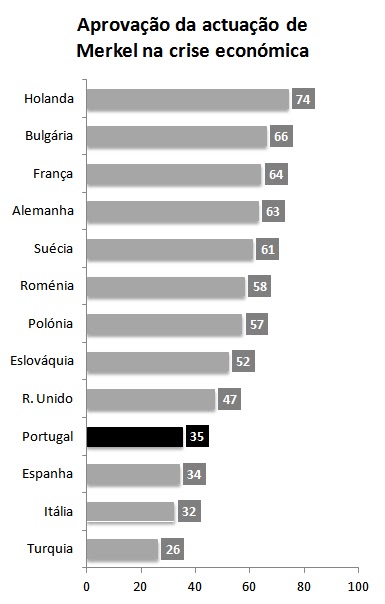
Uma mini-surpresa: na maior parte dos países, a actuação da chanceler Merkel é vista como positiva pela maior parte dos inquiridos. Aqui, claro, há uma clivagem:
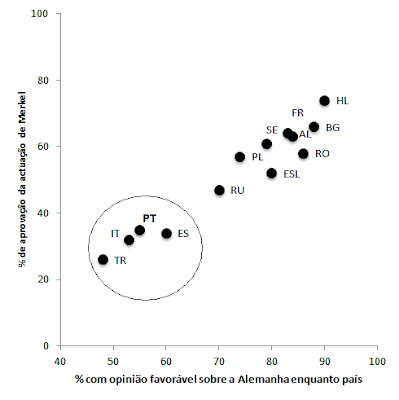
Na Turquia, em Portugal, em Itália, e em Espanha, essa avaliação é predominantemente negativa. E está fortemente relacionada com uma pior opinião da Alemanha enquanto país. Isto é algo que, sendo porventura compreensível na Turquia, me parece um bocado perturbante nos restantes países, devo dizer.
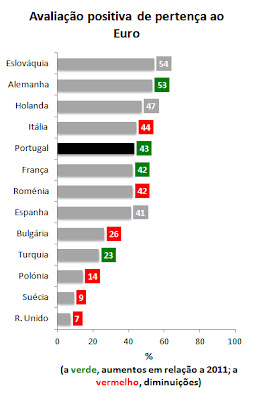
Na maior parte destes países, a avaliação que se faz dos efeitos do Euro (ou dos que seriam os efeitos do Euro para os países que não o têm) é mais negativa que positiva. E onde ele não existe, pelos vistos, poucos o querem. Por outro lado, noutra pergunta, há já 50% de espanhóis que acham que seria melhor sair, valor que chega aos 40% em Portugal...
Que fazer? Uma das perguntas coloca os inquiridos perante três opções: diminuir despesas para diminuir a dívida; manter o nível de despesas; ou aumentar para promover crescimento? O gráfico seguinte mostra as percentagens para a primeira opção:
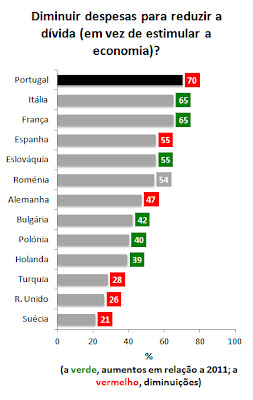
Apesar da diminuição em relação a 2011, Portugal continuava em Junho o campeão da defesa do corte das despesas do Estado. Claro, a pergunta é colocada em abstracto, sem especificar onde se corta, o que facilita o apoio. Para além disso, cortar despesas é bastante diferente de aumentar impostos ou contribuições para a segurança social, o que nos deve tornar ainda mais cuidadosos sobre interpretações destes resultados como sendo de "apoio" às medidas de quaisquer governos. Mas dito isto, há (ou talvez mais exactamente, havia em Junho) um capital político não irrelevante de apoio a uma redução das despesas do estado nalguns países, especialmente em Portugal. Já o que se fez com esse capital é outro assunto.
O que me leva ao último gráfico. "Algumas pessoas dizem que o nosso sistema económico funciona de forma justa para todos, enquanto que outros dizem que a maior parte dos benefícios do nosso sistema só vão para alguns. Qual destas opiniões se aproxima mais da sua?"
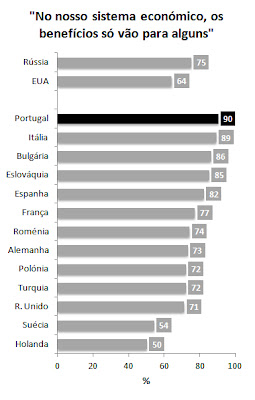
Tal como sucede em todos os estudos que alguma vez me lembro de ter visto sobre este tema, Portugal destaca-se por uma sensibilidade particularmente elevada às questões da justiça distributiva do sistema económico. Num país tão desigual como o nosso e, porventura, com uma cultura política marcada ainda pelo 25 de Abril, não creio que isto seja particularmente surpreeendente. O que surpreende é que seja tão frequentemente esquecido.

Em geral, com poucas excepções, há mais pessoas a avaliar positivamente a actuação da UE do que dos seus próprios governos nacionais. É natural: os governos são partidários, dividem as pessoas; a UE não é vista da mesma forma. Dito isto, é curioso que uma crise cuja responsabilidade tem sido atribuída à incapacidade de decisão na Europa permita, mesmo assim, que na maior parte dos casos a actuação da UE seja vista como positiva. Quem paga as favas são os governos: afinal, são eles que podemos castigar ou recompensar, ao contrário de uma distante e politicamente irresponsável UE. Notar também as excepções: Alemanha, Turquia e Suécia.
Uma mini-surpresa: na maior parte dos países, a actuação da chanceler Merkel é vista como positiva pela maior parte dos inquiridos. Aqui, claro, há uma clivagem:

Na Turquia, em Portugal, em Itália, e em Espanha, essa avaliação é predominantemente negativa. E está fortemente relacionada com uma pior opinião da Alemanha enquanto país. Isto é algo que, sendo porventura compreensível na Turquia, me parece um bocado perturbante nos restantes países, devo dizer.

Na maior parte destes países, a avaliação que se faz dos efeitos do Euro (ou dos que seriam os efeitos do Euro para os países que não o têm) é mais negativa que positiva. E onde ele não existe, pelos vistos, poucos o querem. Por outro lado, noutra pergunta, há já 50% de espanhóis que acham que seria melhor sair, valor que chega aos 40% em Portugal...
Que fazer? Uma das perguntas coloca os inquiridos perante três opções: diminuir despesas para diminuir a dívida; manter o nível de despesas; ou aumentar para promover crescimento? O gráfico seguinte mostra as percentagens para a primeira opção:

Apesar da diminuição em relação a 2011, Portugal continuava em Junho o campeão da defesa do corte das despesas do Estado. Claro, a pergunta é colocada em abstracto, sem especificar onde se corta, o que facilita o apoio. Para além disso, cortar despesas é bastante diferente de aumentar impostos ou contribuições para a segurança social, o que nos deve tornar ainda mais cuidadosos sobre interpretações destes resultados como sendo de "apoio" às medidas de quaisquer governos. Mas dito isto, há (ou talvez mais exactamente, havia em Junho) um capital político não irrelevante de apoio a uma redução das despesas do estado nalguns países, especialmente em Portugal. Já o que se fez com esse capital é outro assunto.
O que me leva ao último gráfico. "Algumas pessoas dizem que o nosso sistema económico funciona de forma justa para todos, enquanto que outros dizem que a maior parte dos benefícios do nosso sistema só vão para alguns. Qual destas opiniões se aproxima mais da sua?"
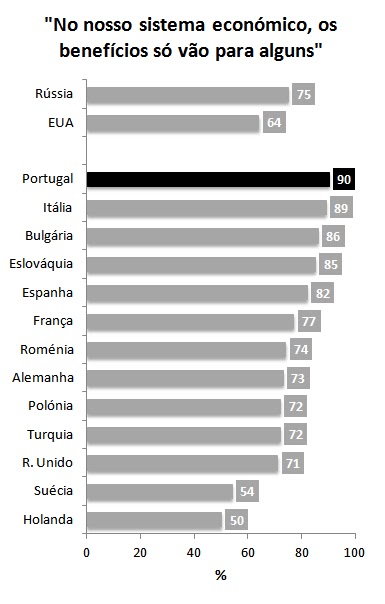
Tal como sucede em todos os estudos que alguma vez me lembro de ter visto sobre este tema, Portugal destaca-se por uma sensibilidade particularmente elevada às questões da justiça distributiva do sistema económico. Num país tão desigual como o nosso e, porventura, com uma cultura política marcada ainda pelo 25 de Abril, não creio que isto seja particularmente surpreeendente. O que surpreende é que seja tão frequentemente esquecido.
quarta-feira, setembro 12, 2012
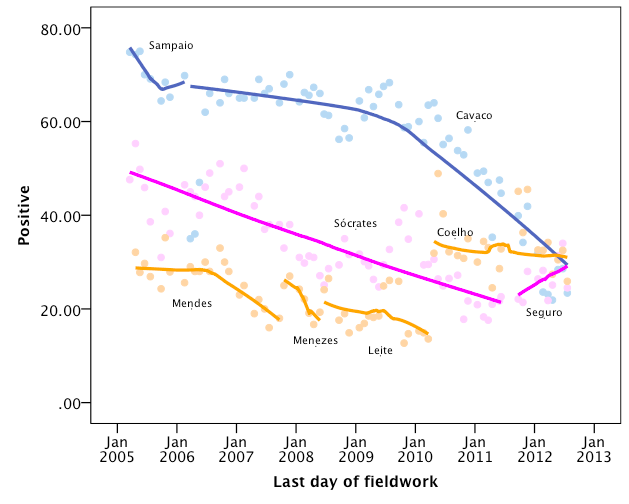
Leader approval
A few days ago I gave you the long-run view on voting intentions. Now for the long-run view on leader approval. Pollsters in Portugal ask this question in very different ways, rendering frequencies not comparable. There are ways to go around this, but for now I decided to focus on a single pollster that makes their data publicly accessible in a very nice way: Marktest. So this is is percentage of respondents who make a "positive" assessment of the performance of the leader of the PS, the PSD, and of the President of the Republic (there's just another response option, "negative") since 2005. The lines are lowess smoothers (80% bandwidth):
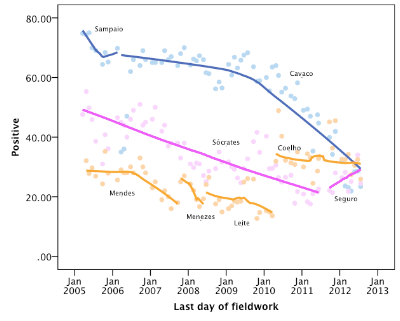
So, a few things:
1. The most remarkable phenomenon is the decline in the President's approval. One would need to display a much longer series to show this fully, but I think it's probably not too bold to say that Cavaco is now the most unpopular President Portugal has ever had since polls have measured this sort of thing regularly (since the mid-1980s). The fact that he is now as popular (or, better put, unpopular) as the two main party leaders is, I think, particularly striking, given the nature of his office.
2. In spite of the decline in the former Prime Minister Sócrates' popularity, PSD never had, until Passos Coelho, somebody who could match him. Furthermore, Passos Coelho started at a level well below the popularity of Sócrates at the beginning of his own term. Having said that, the political and economic circumstances are, of course, dramatically different from those in 2005/2006.
3. A good piece of news for Coelho is that his level of approval has stayed relatively stable until July 2012, unlike his party, which has suffered a decline in voting intentions. Of course, we'll have to see how the horrifying political summer the government has been experiencing will play out in the next polls.
4. Seguro, the new PS leader, has been rising, although having started from very low levels (for PS leaders' usual standards).
segunda-feira, setembro 10, 2012
Martin John Callanan: Letters 2004-2006
An artist called Martin John Callanan sent letters to all heads of state of the world telling them: "I respect your authority." An example:
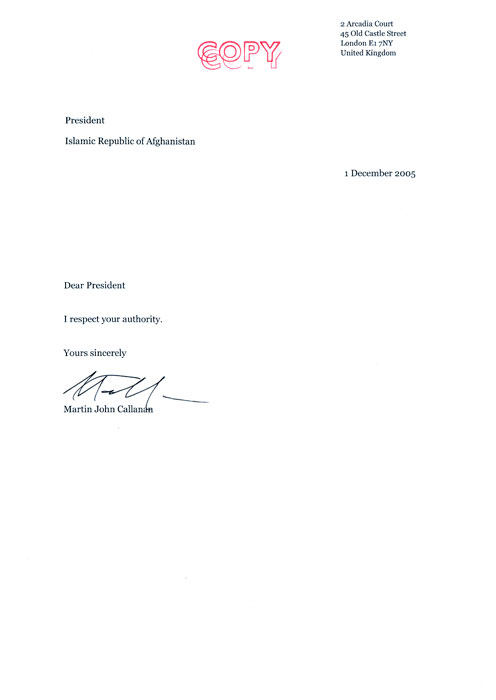
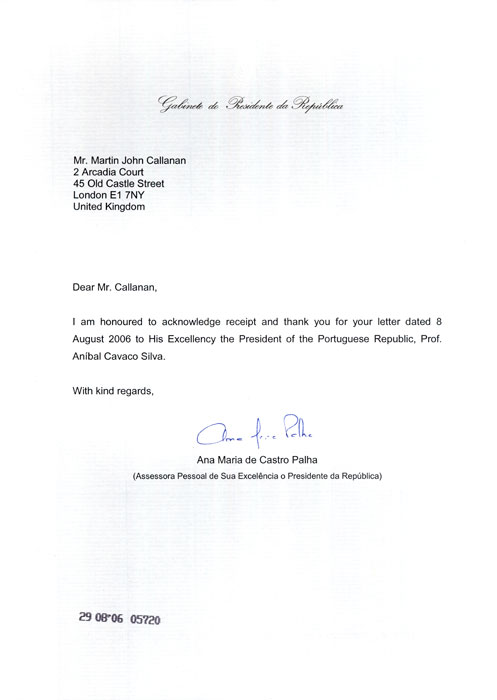
Quite astonishingly, or maybe not, he got a lot of replies. Here's the Portuguese presidency:
Here's Mubarak:

Even better was when Callanan send a letter to dozens of religious leaders asking them "When will it end?":
Here's the Archbishop of Canterbury:

Saw this today at Whitechapel Gallery and thought this might amuse political junkies. There's a book with a selection of the letters, which I duly purchased. Here's Callanan's website, where I'll certainly try to find out more about his work. Like this, for example.
Quite astonishingly, or maybe not, he got a lot of replies. Here's the Portuguese presidency:
Here's Mubarak:
Even better was when Callanan send a letter to dozens of religious leaders asking them "When will it end?":
Here's the Archbishop of Canterbury:
Saw this today at Whitechapel Gallery and thought this might amuse political junkies. There's a book with a selection of the letters, which I duly purchased. Here's Callanan's website, where I'll certainly try to find out more about his work. Like this, for example.
segunda-feira, setembro 03, 2012
Polls in Portugal
All the voting intention polls since the 2005 elections. The vertical lines are the election dates (2005, 2009, and 2011), the lines in color are lowess smoothers (25% bandwitdth). Data taken from here and here (and from my own data until 2009).

On the coalition parties, the PSD is at its lowest level since mid-2010, and the CDS-PP has also been also dropping since the 2011 election. But note how the CDS-PP rose as the 2009 and 2011 elections approached. Predictably, the CDU (the Communist+Green coalition) is the most stable party. Consider, however, that almost all polls since the 2011 election have come from only three polling institutes: the Catholic University has published only two polls since that election and Intercampus hasn't publicly polled since June 2011.
sexta-feira, agosto 03, 2012

quinta-feira, agosto 02, 2012
Economy, Ideology, and the Elephant in the Room
A few years ago, in the aftermath of the Lehman Brothers' collapse and already after two consecutive quarters of negative economic growth in Europe, The Economist asked a few questions about the possible electoral consequences of the economic crisis:
As far as I can tell, there have been two types of answers to these questions. The first has been to suggest an anti-leftist "swing of the pendulum", often illustrated with the defeats of Social Democratic parties in countries such as Britain or Spain. This account has even been espoused by some social-democrats themselves (such as David Milliband, cited here), and even the reactions to the recent victories of the Socialists in France - "Is Europe's left poised for a comeback" - assume the existence of some sort of "anti-leftist wave" that only now may possibly be receding.
The second type of answer has been to suggest that the electoral performance of incumbents in Europe and other industrialized nations has been "business as usual": retrospective voting, with voters punishing or rewarding incumbents on the basis of economic performance. In a widely circulated paper, summarized here, Larry Bartels looks at incumbent parties' electoral performance in the OECD from 2007 to 2011, and makes two arguments. First, that "election outcomes over the course of this 'Great Recession’ have provided little evidence of meaningful judgments on ideology or policy" (Bartels 2012: 44). Second, that economic performance, namely economic growth, accounts well enough for electoral outcomes in this period: "in periods of economic crisis, as in more normal times, voters have a strong tendency to support any policies that seem to work, and to punish leaders regardless of their ideology when economic growth is slow” (Bartels 2012: 50).
In a research note entitled "Economy, Ideology, and the Elephant in the Room," I look at the electoral performance of incumbents in Europe (the EU27 plus Iceland and Croatia) in recent years, covering the period of the Great Recession (early 2008-mid 2009) and the three years since (mid-2009-mid 2012), with data on the 30 legislative elections that occurred in that period, i.e., from Malta in March 2008 until France in June 2012 (replication data here). My starting point was the notion that economic voting theories do not necessarily pose the irrelevance of "ideology". One such argument concerns "policy-oriented" voting, originally proposed by Kiewiet (1983): to the extent that leftist parties emphasize the creation of employment and that increases in unemployment are likely to make voters more concerned with the problem, a worsening of the unemployment situation may actually result in better performance for parties on the left, even if they are the incumbents. A symmetric argument applies for inflation and rightist incumbents (see also Carlsen 2000). Another argument is the "luxury parties" hypothesis: Durr (1993) hypothesized that, while increases in “collective wealth” made citizens more likely to accept policies involving taxation and redistribution, in “times of economic uncertainty or insecurity, citizens will be less supportive of the liberal domestic policy agenda” (p.159). He found that economic downturns in the United States did shift citizens’ policy preferences towards conservatism, while periods of economic expansion drove preferences to the left. Stevenson (2001), Markussen (2008), Kayser (2009), and De Neve (2010) reach similar conclusions: lower economic growth shifts policy preferences away from the left and voting intentions away from “luxury” parties, i.e., those who support generous social programs. What these approaches have in common is the fact that although they see economy decidedly mattering for electoral outcomes, they also suggest that voters make meaningful distinctions between parties in terms of their ideology.
So what did I find? The dependent variable is the change, in percentage points, in the share of the vote for the Prime Minister's party in each election in relation to the preceding one. I regress this on GDP growth in the four quarters before the election's, the change in the unemployment rate in the preceding year, and inflation in the preceding year. Two controls: Time in office (the number of years the same PM party had been continuously in power at time of election) and Previous election result (taking into account the fact that, keeping other things equal, parties that have obtained larger shares of the vote in previous elections are liable to lose more in subsequent elections). Finally, I regress incumbents' electoral performance on dummies capturing party ideology, measured either in terms of expert placements of parties on the left-right scale (Left, source: Parlgov) or in terms of the party families to which they belong (LeftFamily,1 for Social-Democrats and Communists).
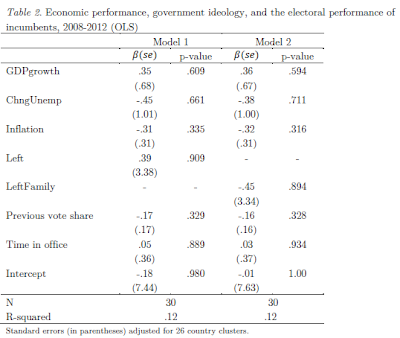
The results are disappointing, to say the least. Most variables have the expected direction, including all the economic variables and previous vote share. However, all are far from conventional statistical significance. In what concerns the possibility of an “anti-leftist wave,” above and beyond what might be dictated by economic performance, the results are not supportive either: the coefficient for Left is positive while the coefficient for LeftFamily is negative, both also far from significant.
What if, however, we consider the possibility that different parties may have performed differently under the same economic conditions? Or to put it in another way, the possibility that the same economic developments affected parties differently? If we add interaction terms between incumbent party ideology and the economic indicators, what do the new results tell us?
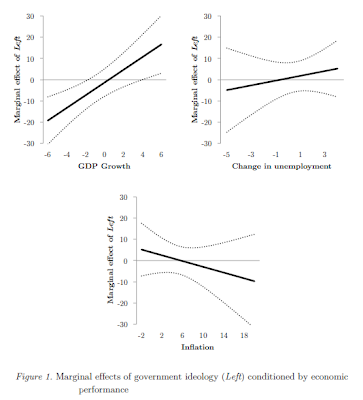
Basically, they tell us that under conditions of low growth, leftist incumbents did significantly worse than rightist, and the the opposite happens in conditions of high growth (results are similar if LeftFamily is used). We can also take a look at the results from a different perspective: did economic developments affect all parties in the same way? The answer is no:
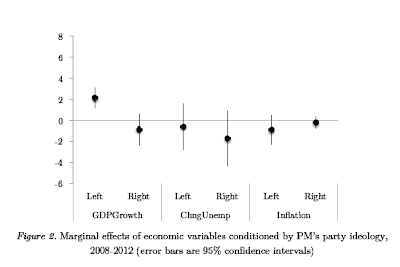
Leftist governments' electoral performance was sensitive to GDP growth, rightist governments' were not.
In sum, the answer to the question of whether there was a “anti-leftist wave” during the Great Depression can therefore be stated in a different way: instead of a simple “No,” what the results tell us is that, indeed, conditions such as the ones that prevailed in 2008-2009 in Europe – economic recession – seem to have resulted in particularly worse performances for leftist incumbents. However, those worse performances should probably not be mistaken by any fundamental change in ideological preferences in Europe irrespective of economic developments: in those countries that experienced economic recoveries in the last few years and where elections were preceded by solid growth, leftist parties ended up doing significantly better than rightist ones. Thus, the data supports the "luxury parties" conjecture, not a mere "retrospective voting" hypothesis. In both figures, the remaining results are also suggestive of "policy-oriented" voting, but the estimates are too imprecise.
Is this all? There is an "elephant in the room." Take a look at incumbent performance since early 2008:

What is striking about this is the fact that, even after the "end" of the Great Recession (mid-2009), incumbent performance continued, on average, to decline, and variations between two different "groups" of countries are clearly visible. I speculate that, in the face of a protracted and yet unresolved financial, currency, and political crisis in the Eurozone, voters may be turning their dissatisfaction with the European crisis to the most obvious and accessible target: domestic governments. The final model tests the hypothesis that part of the divergence in the electoral fate of incumbent parties we see in the figure above is attributable to the governments of Eurozone countries suffering increasing electoral punishments as the crisis remains unresolved, above and beyond the (conditional) effects of the economy. The figure below shows the effects of "time" (Years since January 2008) in the performance of incumbents, depending on whether elections took place in Eurozone countries or not.

By each year elapsed since the beginning of 2008, incumbents in the Eurozone countries have lost 3.3 additional percentage points in the comparison with previous election results (p-value=0.027). For the other countries, the point estimate of the marginal effect is -1.7 and is very far from statistical significance. In other words, there has been a decline in incumbent performance experienced since the beginning of the Great Recession, above and beyond what could be expected on the basis of other factors, and that decline seems to be most clearly a phenomenon that has taken place in the countries of the Eurozone.
That the national governments of the Eurozone seem to be bearing the electoral brunt of what can only be seen as a much broader and systemic failure may be seen as a fundamental problem of democratic accountabily, given the highly complex network of economic factors and political actors at play. However, we should also not forget that European voters and governments have been playing this flawed accountability game for a very long time now. In a sense, there is even a sort of poetic justice in these developments. National goverments have been notorious for engaging in extensive blame-shifting to the EU level when faced with negative domestic outcomes and in credit-taking for the sucesses and benefits of integration. Now that the failure is, perhaps for the first time, a truly “European” one, the chickens are coming home to roost.
"First, will any overall swing of the pendulum between left and right be clearly detectable? Will, for example, the fall-out from the current financial crisis benefit parties that favour more government involvement in the economy? Second, will voters tend to reject incumbents (perhaps because of the gathering economic troubles), or tend to stick with the leaders they know in uncertain times?"
As far as I can tell, there have been two types of answers to these questions. The first has been to suggest an anti-leftist "swing of the pendulum", often illustrated with the defeats of Social Democratic parties in countries such as Britain or Spain. This account has even been espoused by some social-democrats themselves (such as David Milliband, cited here), and even the reactions to the recent victories of the Socialists in France - "Is Europe's left poised for a comeback" - assume the existence of some sort of "anti-leftist wave" that only now may possibly be receding.
The second type of answer has been to suggest that the electoral performance of incumbents in Europe and other industrialized nations has been "business as usual": retrospective voting, with voters punishing or rewarding incumbents on the basis of economic performance. In a widely circulated paper, summarized here, Larry Bartels looks at incumbent parties' electoral performance in the OECD from 2007 to 2011, and makes two arguments. First, that "election outcomes over the course of this 'Great Recession’ have provided little evidence of meaningful judgments on ideology or policy" (Bartels 2012: 44). Second, that economic performance, namely economic growth, accounts well enough for electoral outcomes in this period: "in periods of economic crisis, as in more normal times, voters have a strong tendency to support any policies that seem to work, and to punish leaders regardless of their ideology when economic growth is slow” (Bartels 2012: 50).
In a research note entitled "Economy, Ideology, and the Elephant in the Room," I look at the electoral performance of incumbents in Europe (the EU27 plus Iceland and Croatia) in recent years, covering the period of the Great Recession (early 2008-mid 2009) and the three years since (mid-2009-mid 2012), with data on the 30 legislative elections that occurred in that period, i.e., from Malta in March 2008 until France in June 2012 (replication data here). My starting point was the notion that economic voting theories do not necessarily pose the irrelevance of "ideology". One such argument concerns "policy-oriented" voting, originally proposed by Kiewiet (1983): to the extent that leftist parties emphasize the creation of employment and that increases in unemployment are likely to make voters more concerned with the problem, a worsening of the unemployment situation may actually result in better performance for parties on the left, even if they are the incumbents. A symmetric argument applies for inflation and rightist incumbents (see also Carlsen 2000). Another argument is the "luxury parties" hypothesis: Durr (1993) hypothesized that, while increases in “collective wealth” made citizens more likely to accept policies involving taxation and redistribution, in “times of economic uncertainty or insecurity, citizens will be less supportive of the liberal domestic policy agenda” (p.159). He found that economic downturns in the United States did shift citizens’ policy preferences towards conservatism, while periods of economic expansion drove preferences to the left. Stevenson (2001), Markussen (2008), Kayser (2009), and De Neve (2010) reach similar conclusions: lower economic growth shifts policy preferences away from the left and voting intentions away from “luxury” parties, i.e., those who support generous social programs. What these approaches have in common is the fact that although they see economy decidedly mattering for electoral outcomes, they also suggest that voters make meaningful distinctions between parties in terms of their ideology.
So what did I find? The dependent variable is the change, in percentage points, in the share of the vote for the Prime Minister's party in each election in relation to the preceding one. I regress this on GDP growth in the four quarters before the election's, the change in the unemployment rate in the preceding year, and inflation in the preceding year. Two controls: Time in office (the number of years the same PM party had been continuously in power at time of election) and Previous election result (taking into account the fact that, keeping other things equal, parties that have obtained larger shares of the vote in previous elections are liable to lose more in subsequent elections). Finally, I regress incumbents' electoral performance on dummies capturing party ideology, measured either in terms of expert placements of parties on the left-right scale (Left, source: Parlgov) or in terms of the party families to which they belong (LeftFamily,1 for Social-Democrats and Communists).
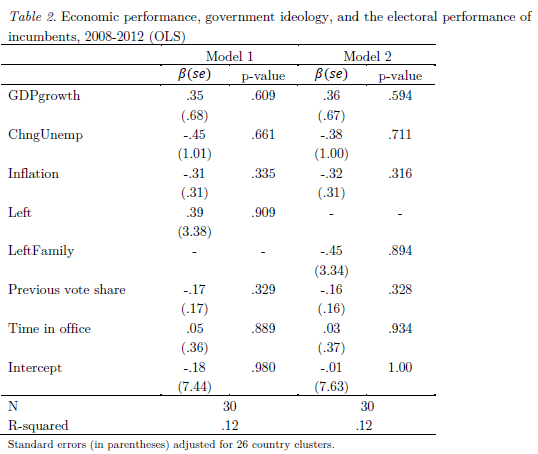
The results are disappointing, to say the least. Most variables have the expected direction, including all the economic variables and previous vote share. However, all are far from conventional statistical significance. In what concerns the possibility of an “anti-leftist wave,” above and beyond what might be dictated by economic performance, the results are not supportive either: the coefficient for Left is positive while the coefficient for LeftFamily is negative, both also far from significant.
What if, however, we consider the possibility that different parties may have performed differently under the same economic conditions? Or to put it in another way, the possibility that the same economic developments affected parties differently? If we add interaction terms between incumbent party ideology and the economic indicators, what do the new results tell us?

Basically, they tell us that under conditions of low growth, leftist incumbents did significantly worse than rightist, and the the opposite happens in conditions of high growth (results are similar if LeftFamily is used). We can also take a look at the results from a different perspective: did economic developments affect all parties in the same way? The answer is no:
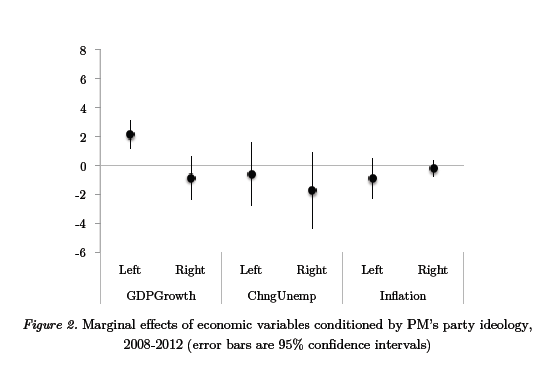
Leftist governments' electoral performance was sensitive to GDP growth, rightist governments' were not.
In sum, the answer to the question of whether there was a “anti-leftist wave” during the Great Depression can therefore be stated in a different way: instead of a simple “No,” what the results tell us is that, indeed, conditions such as the ones that prevailed in 2008-2009 in Europe – economic recession – seem to have resulted in particularly worse performances for leftist incumbents. However, those worse performances should probably not be mistaken by any fundamental change in ideological preferences in Europe irrespective of economic developments: in those countries that experienced economic recoveries in the last few years and where elections were preceded by solid growth, leftist parties ended up doing significantly better than rightist ones. Thus, the data supports the "luxury parties" conjecture, not a mere "retrospective voting" hypothesis. In both figures, the remaining results are also suggestive of "policy-oriented" voting, but the estimates are too imprecise.
Is this all? There is an "elephant in the room." Take a look at incumbent performance since early 2008:

What is striking about this is the fact that, even after the "end" of the Great Recession (mid-2009), incumbent performance continued, on average, to decline, and variations between two different "groups" of countries are clearly visible. I speculate that, in the face of a protracted and yet unresolved financial, currency, and political crisis in the Eurozone, voters may be turning their dissatisfaction with the European crisis to the most obvious and accessible target: domestic governments. The final model tests the hypothesis that part of the divergence in the electoral fate of incumbent parties we see in the figure above is attributable to the governments of Eurozone countries suffering increasing electoral punishments as the crisis remains unresolved, above and beyond the (conditional) effects of the economy. The figure below shows the effects of "time" (Years since January 2008) in the performance of incumbents, depending on whether elections took place in Eurozone countries or not.

By each year elapsed since the beginning of 2008, incumbents in the Eurozone countries have lost 3.3 additional percentage points in the comparison with previous election results (p-value=0.027). For the other countries, the point estimate of the marginal effect is -1.7 and is very far from statistical significance. In other words, there has been a decline in incumbent performance experienced since the beginning of the Great Recession, above and beyond what could be expected on the basis of other factors, and that decline seems to be most clearly a phenomenon that has taken place in the countries of the Eurozone.
That the national governments of the Eurozone seem to be bearing the electoral brunt of what can only be seen as a much broader and systemic failure may be seen as a fundamental problem of democratic accountabily, given the highly complex network of economic factors and political actors at play. However, we should also not forget that European voters and governments have been playing this flawed accountability game for a very long time now. In a sense, there is even a sort of poetic justice in these developments. National goverments have been notorious for engaging in extensive blame-shifting to the EU level when faced with negative domestic outcomes and in credit-taking for the sucesses and benefits of integration. Now that the failure is, perhaps for the first time, a truly “European” one, the chickens are coming home to roost.
quarta-feira, agosto 01, 2012

quinta-feira, julho 19, 2012
quarta-feira, julho 18, 2012


terça-feira, julho 17, 2012
Da análise da produtividade científica na Sociologia
"As the sociology’s founding institute in Portugal, ICS-UL retained its leadership position for some time; however, as far as sociology is concerned, it has been overtaken by CIES-IUL. While both institutes occupy a leading role in terms of SCG, CIES-IUL is presently ahead of ICS-UL because it has a much larger and more productive team."
Fernando Luís Machado, Director do... CIES-IUL, num artigo publicado numa revista científica.
Fernando Luís Machado, Director do... CIES-IUL, num artigo publicado numa revista científica.
sexta-feira, junho 15, 2012
Eurosondagem, 12 Jun, N=1022, Tel.
PSD: 34.3% (-0.5)
PS: 32.1% (+0.9)
CDS-PP: 11.6% (-0.9)
CDU: 9% (+0.2)
BE: 6.9% (+0.4)
Here, basically suggesting that the last known poll was not an outlier.
PS: 32.1% (+0.9)
CDS-PP: 11.6% (-0.9)
CDU: 9% (+0.2)
BE: 6.9% (+0.4)
Here, basically suggesting that the last known poll was not an outlier.
sexta-feira, junho 08, 2012


quarta-feira, junho 06, 2012
Tidbits
Interesting tidbits from the last Catholic University poll (Portugal, registered voters, N=1366, face to face, 49% response rate):
- 67% evaluate the government's performance as "bad" or "very bad."And yet, 58% believe that no opposition party could do better.
- Passos Coelho and Paulo Portas, the leaders of the coalition parties, have the worst evaluations of all party leaders.
- Miguel Relvas is judged the worst member of cabinet, by far. Vítor Gaspar, the Finance Minister, the best (or least bad, so to speak.).
- Cavaco Silva, the President, has the worst evaluation ever, for himself and for any President before him.
- 72% support staying in the Eurozone. 20% support return to Escudo.
- 59% expect need for further EU/IMF support.
- 58% think it unlikely Portugal descends into a Greek scenario.
terça-feira, junho 05, 2012
Portuguese polls
A new poll out today. Below, an update of our usual graph (the lines are local regression smoothers, 75% bandwidth) already including it. One result of that poll that may surprise some people is that the Left (the Communists + the Left Bloc) adds up to 18% in voting intentions. But as you see below, it's not even the first time that happened.


segunda-feira, maio 14, 2012
PS and PSD in the Portuguese polls
As usual, very few polls, nothing since April 20th (!), everything very dependent on the leverage of particular polls from particular pollsters. And yet, note the recent unusual pattern when we take into account normal polling patterns for PSD and PS: one party's loss has ceased to be the other party's gain.

I'll leave the deep interpretation to you, but it doesn't seem too difficult.

I'll leave the deep interpretation to you, but it doesn't seem too difficult.
sexta-feira, maio 04, 2012
French polls, 2nd round (May 4th update)
Including polls made public yesterday and today:

And zooming in on the last month:

So I would not open the bottle of champagne right now.
And zooming in on the last month:

So I would not open the bottle of champagne right now.
terça-feira, maio 01, 2012
France 2nd round polls, May 1st update

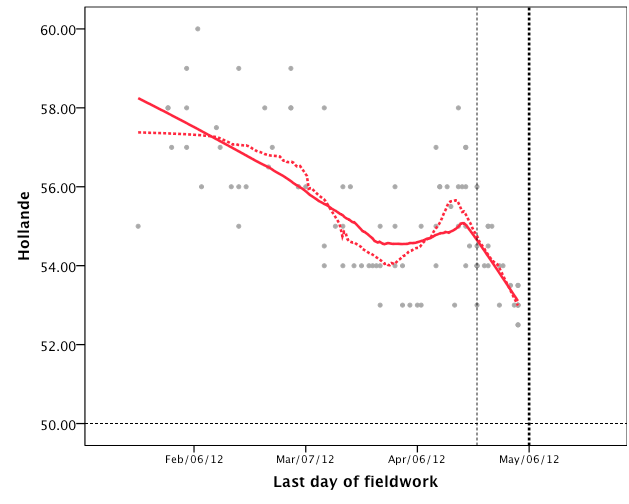
There's a petit frisson around Sarkozy "narrowing the gap," and yes, there may be something going on along those lines. But a little perspective: looking at the last two polls of each of the eight pollsters, Holland has declined in just four of them, and by a maximum of two points. The lowest score for Hollande in any poll is 53%, i.e, about what Sarkozy had against Royal at about this point in the campaign in 2007, or what Chirac had against Jospin in 1995. Sarkozy ended up with 53.1% of the vote and Chirac with 52.6%. Having said that, considering his record, it's quite extraordinary that Sarkozy manages to keep this even vaguely competitive. And I can't help thinking about the famous "shy Tories" phenomenon in the UK 1992 election: could it be that polls are underestimating the rightist vote? French pollsters have a good track record, but that's only if you decide to discount the FN vote. A Socialist candidate as favorite is, as we know, an unusual phenomenon. And a look at the technical reports of the French polls shows quota sampling all over the place, and it's difficult not to be a little freaked out about that.
segunda-feira, abril 30, 2012
France 2nd round polls, April 30th update
Eight pollsters now (Ifop, LH2, Harris, Ipsos, BVA, CSA, Harris, TNS Sofres). Source: Sondages en France. Since January 15th. Last polls: Ipsos and LH2 (fieldwork completed on the 28th):


sábado, abril 28, 2012

quinta-feira, abril 26, 2012
The last (official) Greek polls
Here. The extreme values, rounded:
ND 22-25.5%
PASOK 17-19%
Syriza 9-11%
KKE 9-11%
Independent Greeks 8-10%
Democratic Left 5-9%
Golden Dawn 4-5%
LAOS 3-4%
Ecogreens 3-4%
Democratic Alliance 3-4%
Drazi 1-2%
Lots of undecided too (20% or above). Election day is May 6th.
ND 22-25.5%
PASOK 17-19%
Syriza 9-11%
KKE 9-11%
Independent Greeks 8-10%
Democratic Left 5-9%
Golden Dawn 4-5%
LAOS 3-4%
Ecogreens 3-4%
Democratic Alliance 3-4%
Drazi 1-2%
Lots of undecided too (20% or above). Election day is May 6th.
French 2nd round polls
A quick look at the French 2nd round polls. Data taken from Sondages en France, 2nd round voting intentions for Hollande, six pollsters (Ifop, Ipsos, Opinion-Way, Harris, BVA, CSA), 63 polls total since January 22nd. I show two Lowess lines, one more sensitive than the other. Vertical lines are the 1st and 2nd round election dates. It takes a lot of zooming to get any inkling of change, but there it is: Hollande declining until early April, no clear evidence of change ever since, certainly too early to detect any post-1st round changes.


segunda-feira, abril 23, 2012
The polls in France
The last French polls did well, by comparative standards at least. In 2007, no pollster managed to estimate the vote for the first four candidates with an average absolute error below 2 points. In some cases, like in the CSA last poll, things were even worse, with Sarkozy's vote underestimated by almost 6 points and Le Pen's vote overestimated by more than 6 points. Things went better this time: Hollande and Sarkozy did slightly better than expected, and the major problems came with Le Pen and Mélenchon doing, respectively, better and worse that what the polls were suggesting, but still with deviations that were not so large as the ones that occurred in 2007.

A pollster-by-pollster look suggests that, in most cases, whatever may have been behind the over- or under-estimation of candidates' results was common to all pollsters: Le Pen was consistently underestimated, Mélenchon was consistently overestimated and, with few exceptions, the underestimation of both Hollande and Sarko were also common (and relatively small).
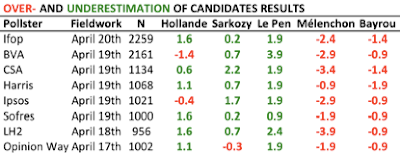
Things continue to look bleak for Sarkozy. In 2007, for the 2nd round results, Sarkozy got a majority of the votes in almost every single poll published since the beginning of the year:
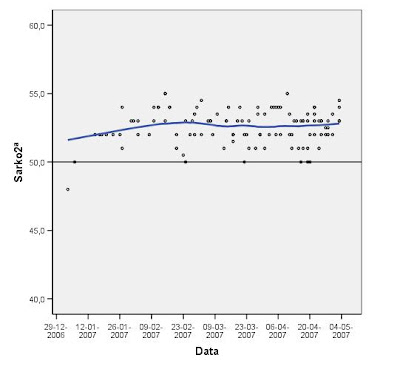
Now, Sarkozy faces the exact opposite situation: he has been behind Hollande in every single poll published since at least February, and the polls conducted yesterday place him behind Hollande at least 6 points.

A pollster-by-pollster look suggests that, in most cases, whatever may have been behind the over- or under-estimation of candidates' results was common to all pollsters: Le Pen was consistently underestimated, Mélenchon was consistently overestimated and, with few exceptions, the underestimation of both Hollande and Sarko were also common (and relatively small).
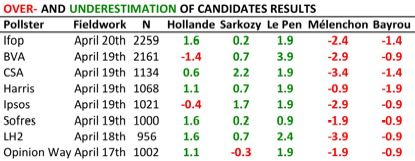
Things continue to look bleak for Sarkozy. In 2007, for the 2nd round results, Sarkozy got a majority of the votes in almost every single poll published since the beginning of the year:

Now, Sarkozy faces the exact opposite situation: he has been behind Hollande in every single poll published since at least February, and the polls conducted yesterday place him behind Hollande at least 6 points.
sábado, abril 21, 2012
Eurosondagem, 11-17 Abril, N=1036, Tel.
PSD: 35.3% (-0.7%)
PS: 30.5% (0.9%)
CDS-PP: 10.7% (-1.3%)
CDU: 9.1% (+0.6%)
BE: 6.4% (-0.5%)
Aqui. Para a jornalista Cristina Figueiredo, do Expresso, mudanças abaixo de um ponto percentual numa sondagem significam "Passos e Governo caem, Seguro e PS sobem." Realmente, gastar massa numa sondagem para depois vir dizer que está tudo exactamente na mesma é chato.
Portugal, abreviado
"Imagine que tem um problema na canalização da sua casa. Chama um técnico que lhe diz que terá de pagar 100€ pelo arranjo. Se quiser factura, serão 123€. Pedia ou não factura?
Pedia: 31%
Não pedia: 64%
Ns/Nr: 5%"
Aqui.
Pedia: 31%
Não pedia: 64%
Ns/Nr: 5%"
Aqui.
quinta-feira, abril 19, 2012
French forecasting models
The April issue of French Politics (ungated) is dedicated to several fun articles forecasting the 2012 French elections. Nadeau, Lewis-Beck, and Bélanger, using simultaneous equations to deal, in the one hand, with the relationship between incumbent popularity and vote for the leftist candidates in the first round and, on the other hand, the relationship between unemployment, time in office, cohabitation, and incumbent popularity, predict that the Left will get a (narrow) majority of the votes in the first round. Nadeau and Lewis-Beck (again) and Didier then take a look at second-round vote as a function of presidential approval measured 4 months before the election and the image of the candidates, and suggest that Sarkozy is in rather bad shape for the second round, albeit not so bad as polls were suggesting a few months ago. Foucault focuses on legislative elections, using local data on unemployment, national GDP data, PM's popularity, local data again on previous electoral performance of the incumbent, and a couple of other specificities, and concludes that the Left will have a narrow majority of the votes (in the last issue of PS, Foucault and Nadeau also use local data, which is then aggregated and weighted to arrive at a prediction of a - narrow - Sarkozy defeat). Evans and Ivaldi predict Marine Le Pen with around 17%. But Jerôme and Jerôme-Speziari, using regional data, actually give a very close advantage to Sarkozy. As one of the papers notes, "a victory in 2012 would certainly qualify Sarkozy as one of the most successful campaigners in modern times." I guess at least that is safe to say.
terça-feira, abril 03, 2012
Political consequences of the economic crisis: voting and protesting in Europe since 2008
This is the title of a conference jointly organized by the Department of Government and the BMW Center for German and European studies of Georgetown University. April 17th (from 9.30am to 3.00pm) and 18th (10.00am to 5.30pm) at the Edward B. Bunn Intercultural Center, 7th Floor Conference Room.
Participants, by order of presentation:
Indridi Indridason (U California Riverside)
Michael Marsh (Trinity, Dublin)
Pedro Magalhães (U Lisbon and Georgetown U)
Mariano Torcal (Pompeu Fabra, Barcelona)
Eftichia Teperoglou (MZES, Mannheim and CIES-ISCTE, Lisbon)
Emmanouil Tsatsanis (U Athens and CIES-ISCTE, Lisbon)
Paolo Bellucci (U Siena)
António Costa Pinto (U Lisbon)
David S. Muir (Director of Political Strategy for British Prime Minister Gordon Brown, 2008-2011)
Josep Colomer (Georgetown U)
Nuno Mota Pinto (World Bank)
Pedro Gete (Georgetown U)
John Karamichas (Queen’s U, Belfast)
Pedro Ramos Pinto (U Manchester)
Irene Martín (U Autónoma Madrid)
Harold Clarke (U T Dallas)
Raymond Duch (Oxford U)
Closing the morning session on the 18th, we'll have Ambassador Nuno Brito, Ambassador of Portugal in the USA. Closing the afternoon session, we'll have Minister Antonio de Lecea, Principal Advisor on Economic and Financial Affairs at the EU Delegation in the USA.
Full programme here. Kind support from the Luso-American Development Foundation and from the Endesa Foundation.
And here's the paper I'll be presenting on the 2011 Portuguese elections. Comments very welcome.
Bleeding stopped?
Added two new polls to the graph, Eurosondagem and Marktest. PSD seems pretty stable in the last three polls. But it's just three polls...


sexta-feira, março 16, 2012
terça-feira, março 13, 2012
Polls in Portugal since the June 2011 elections
With the latest Aximage poll, this is where we stand in terms of voting intentions since the June 2011 elections. A linear trend instead of fancier stuff just seemed simple and informative enough.

Bad news for the President too. At Aximage, 60% disapproval. In the latest Marktest, 61% disapproval. Yikes! In the latest Eurosondagem, much better, but still declining pretty steeply. Sure, everybody in power suffers with a bad economy, but it's clear that there's more to this.

Bad news for the President too. At Aximage, 60% disapproval. In the latest Marktest, 61% disapproval. Yikes! In the latest Eurosondagem, much better, but still declining pretty steeply. Sure, everybody in power suffers with a bad economy, but it's clear that there's more to this.
segunda-feira, março 12, 2012
Elections in Europe since 2004
This is from a paper I'm still writing with Josep Colomer, but the figures seemed so interesting I couldn't resist sharing them even before the paper's finished. Here's the relative change for the party of the incumbent Prime Minister in comparison with the previous election, for all legislative elections from 2004 to 2011 in all EU27 + Iceland and Croatia.

And this is the same splitting the PM's parties in Left (<5) vs. Right (>5), on the basis of 0-10 expert scores that can be obtained in the Parlgov website.


And this is the same splitting the PM's parties in Left (<5) vs. Right (>5), on the basis of 0-10 expert scores that can be obtained in the Parlgov website.
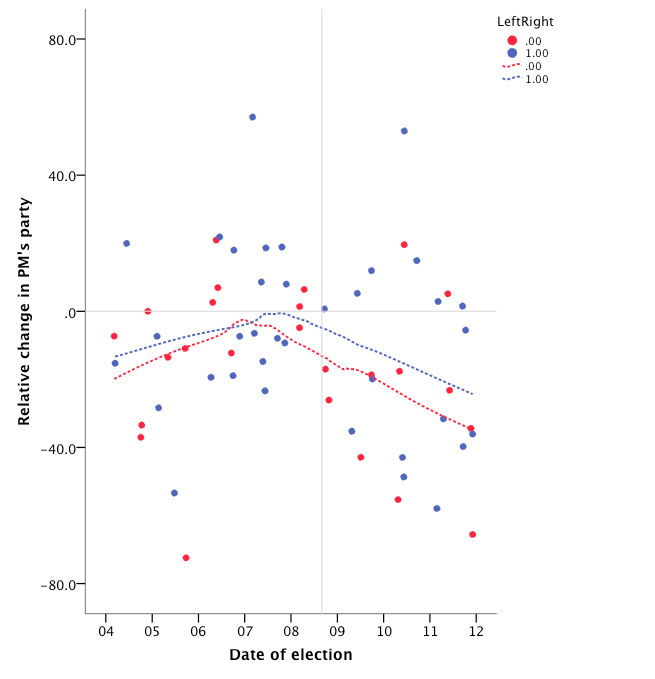
Subscrever:
Mensagens (Atom)